 croissant
Combining campaign conversion rates: use totals before averages
A practical agency guide to combining conversion rates and cost per lead, with weighted calculations, synthetic examples and checks before client review.
To combine campaign conversion rates, add compatible conversion counts and their eligible interaction counts, then divide the totals. Do not take a simple average of the displayed percentages unless your question specifically gives each campaign equal weight. For cost per lead, divide compatible total spend by the corresponding total leads. If definitions, currencies or populations differ, keep the figures separate until a person approves a valid comparison. A reporting automation should calculate the agreed measure before AI writes the explanation.
Decide what the combined number should answer
An agency account lead may want to know what share of all eligible ad interactions produced a recorded conversion. That is a different question from the average performance of an equally weighted campaign. Write the question above the spreadsheet or dashboard tile. Otherwise a mathematically valid average can answer the wrong business question.
Google Ads defines conversion rate using conversions divided by trackable ad interactions for the same period. Its documentation also explains that multiple conversion actions or the Every counting setting can produce a rate above 100%. A value above 100% therefore needs a definition check rather than an automatic clamp to 100%. These are Google Ads rules, not a universal definition for every reporting source. [1]
Keep source-specific rates labeled. Google Analytics defines session key event rate as the percentage of sessions with a key event; it also provides a separate user key event rate. A session, a user and an ad interaction are different denominators. Combining these rates under a single conversion-rate label would hide that distinction. [2]
Worked example: the simple average answers a different question
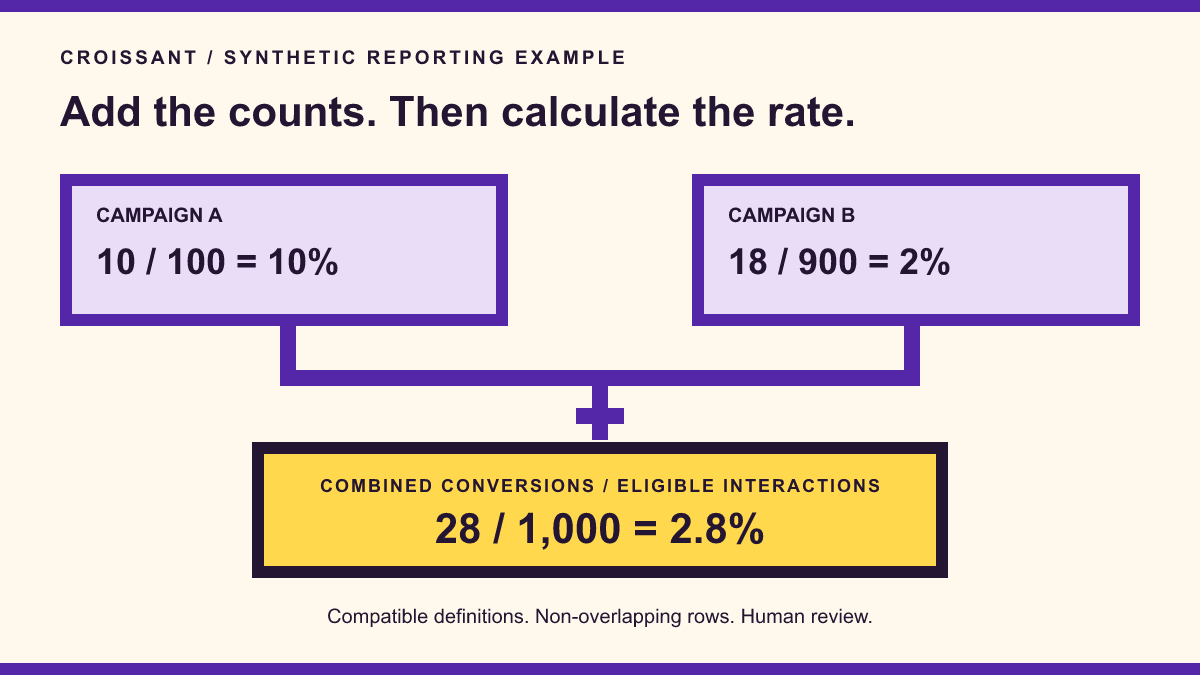
All figures in this guide are synthetic. Suppose fictional Campaign A records 10 conversions from 100 eligible interactions, a 10% rate. Campaign B records 18 from 900, a 2% rate. Assume the two rows are non-overlapping and use the same conversion definition, counting rules, reporting window and eligible interaction measure.
The simple average of 10% and 2% is 6%. But the combined interaction-based rate is (10 + 18) divided by (100 + 900), or 28 / 1,000 = 2.8%. Campaign B contributes nine times as many interactions, so it contributes nine times the denominator weight. The arithmetic can also be expressed as a denominator-weighted average of the unrounded rates.
For a client report about all eligible interactions, use 2.8% and retain the component counts. If an internal analyst deliberately wants an equally weighted campaign average, 6% can be shown with that exact label. Neither figure proves which campaign caused additional business or whether tracking captured every outcome. Avoid describing their difference as an error until the intended question is clear.
Use raw counts where available, then round the final display. Rebuilding totals from rounded percentages can introduce avoidable differences. If the export contains rates alone, request the matching denominators or a properly scoped source total. Do not invent counts to make a combined tile possible.
Apply the same discipline to cost per lead
Consider another synthetic example with a team-defined accepted-lead measure. Campaign A spends USD 200 for 10 accepted leads, giving USD 20 per lead. Campaign B spends USD 1,800 for 30 accepted leads, giving USD 60 per lead. The equally weighted average of those costs is USD 40, while total spend divided by total accepted leads is USD 2,000 / 40 = USD 50.
For this combined cost measure, leads supply the weights. Do not reuse interaction weights simply because they worked for conversion rate. Store each measure's numerator, denominator and unit with its calculation. Define whether spend includes only media or also agreed fees, and apply that scope consistently. This is Croissant's recommended reporting convention, not a claim that every platform calculates cost per lead this way.
A campaign with spend and zero leads still contributes its spend to an otherwise valid combined total. Its individual cost per lead is undefined, rather than USD 0. If the entire denominator is zero, display unavailable or undefined with an explanation. An unavailable lead export is a separate collection failure and must never become an observed zero.
Check whether rows can be added at all
Before adding anything, check that the rows describe disjoint parts of the intended population. A campaign total plus its device breakdown would count the same activity twice. Two platforms may also attribute credit to the same underlying enquiry. Adding their attributed conversion counts does not establish a count of unique business leads. Keep that combined claim out of the report unless an approved matching and attribution method supports it.
For each proposed rollup, record the source account, exact metric, numerator, denominator, period, time zone, filters and counting basis. For money, record currency and the agreed conversion rule if conversion is necessary. For lead measures, state whether the unit is an event, a distinct enquiry or an accepted CRM record. A matching column label is insufficient evidence that units match.
If the question is why source systems disagree, use the separate agency reporting workflow guide. This guide addresses how to aggregate compatible ratios after that comparison basis is established. A combined total should remain unavailable when compatibility is unresolved, even if the dashboard has an inviting empty tile.
Build a small calculation contract before adding AI
Start with one report and one ratio. Have the account lead approve the business question and have the reporting owner approve the formula, units and allowed source rows. In a small team the same person may hold both roles, but record both decisions. Keep this contract beside the existing report template so a replacement colleague can reproduce the number.
Next collect the permitted component values and their source references. Run explicit arithmetic in the spreadsheet or calculation step. Pass AI the resulting value, formula label, included rows and unresolved exceptions. Ask it to explain those supplied facts without inventing a cause, deduplicating leads from guesswork or selecting a new metric definition.
For the first synthetic example, an acceptable draft is: 'Across the two included campaigns, 28 recorded conversions from 1,000 eligible interactions give a combined rate of 2.8%. Campaign definitions and reporting scope were checked before aggregation.' The reviewer must actually perform those checks before that final sentence can appear in a real report.
Test unequal denominators, a zero denominator, an unavailable export, overlapping rows and a changed conversion definition. Confirm that the calculation handles the approved cases and holds the others for review. Keep client distribution and campaign budget decisions with an authorized person; a reporting calculation does not authorize either action.
Make the buying decision proportional to the problem
A spreadsheet with protected formulas may be enough when exports are consistent and someone checks the inputs. Consider a connected workflow when recurring collection, compatibility checks and exception routing are the larger burden. Ask a builder to demonstrate the unequal-denominator example and an incompatible-source case before discussing a broader rollout.
Use the reporting demo as context for that discussion. Through the Croissant contact form, describe the decision your report supports, the source tools and one fictional calculation. Keep private client exports and credentials out of the initial enquiry. The useful outcome is a number your reviewer can reproduce, with its limits visible before anyone acts on it.
Implementation checklist
- Write the customer question and label the intended combined measure.
- Confirm compatible units, counting rules, reporting scope and non-overlapping rows.
- Retain component numerators and denominators; calculate from totals before rounding.
- Use the correct denominator weights for each ratio.
- Keep zero denominators, missing exports and incompatible data visibly distinct.
- Test unequal weights, overlap and changed definitions with synthetic records.
- Have a person review the calculation and approve client distribution separately.
The sources behind the sauce.
Primary research and official documentation behind the cited points. The workflow examples and checklists are Croissant’s own guidance.